Monday, 20 November 2006

Is California Going Bankrupt?

History is about to repeat in California as the State's cash flood may be receding.
It's familiar: A handful of Californians make a killing on investments, and their tax payments send state revenues soaring. Lawmakers go on a spending spree, without a plan for paying the bills when fortunes turn.

That was the late 1990s, when the dot-com boom made the state flush but the gains proved fleeting, and California came perilously close to running out of cash.

Now, as Gov. Arnold Schwarzenegger prepares a landmark program to expand healthcare coverage to millions of uninsured residents, economists say the state may not have the funds to pay for it. Although tax receipts rose this year, they say, California is once again on budget quicksand.

"I'm at a loss to see how they are going to balance this budget," said Stephen Levy, director of the Center for the Continuing Study of the California Economy in Palo Alto.

"The state got bailed out last time around by a surprise revenue surge. That is unlikely to happen again."

The expanded programs in Schwarzenegger's election-year budget were funded largely by Silicon Valley millionaires — capital gains taxes on people who cashed in Google stock, for example, accounted for nearly $500 million in revenue, several experts said — and by the bubble in the housing market that began to deflate after tax receipts that fueled this year's spending were tallied.

"These surges don't last forever," said Ted Gibson, a former state economist. "At some point … that revenue stream will either diminish or completely dry up."

The governor Tuesday brushed aside warnings that state coffers could soon start to shrink. Referring to the $37-billion public-works borrowing package voters approved last week, Schwarzenegger said: "There will be so much construction activities going on that where the private sector will fall off, the public sector will pick up."

"With our infrastructure bonds, we will again stimulate the economy," he said.

"We're going to have a big revenue problem," said Christopher Thornberg, a partner at Beacon Economics in Los Angeles. "It is going to be a mess and Schwarzenegger in a year is going to wonder why he wanted to be reelected…. Sacramento is not going to have the cash to pay for things it wants."

In 1965, personal income taxes — one of the most volatile sources of cash for the state — accounted for less than a fifth of the state's revenues. Now they make up nearly half.

After voters rejected his "Live Within Our Means Act" in last year's special election, the governor changed course, supporting big spending increases for government programs. Democrats, too, dropped their call for changes in the tax code as state coffers swelled and more money was on the table — at least temporarily — to fund their policy priorities.

Now, analysts say, the inaction may come back to haunt the state. The influx of cash "we've seen in the last couple of years could go in the other direction," said Brad Williams, an economist in Hill's office. "It is just a question of when."
I am stunned. I should not be but I am. How can anyone possibly think .... "With our infrastructure bonds, we will again stimulate the economy"? The Arnold sounds like he is bragging that California's infrastructure is in bad shape. "There will be so much construction activities going on that where the private sector will fall off, the public sector will pick up."

Perhaps other states should wreck their roads and demolish their hospitals just so they too can be lucky enough to get voters to pass bond issues to stimulate the economy. Dear Arnold write this down on the blackboard are read it until you understand it: Unfunded public sector spending is exactly why this country is in the mess it is in. We have wasted well over half a trillion dollars in Iraq and exactly what did that stimulus buy us?

If floating bonds will stimulate the economy enough to pay for themselves why not float a trillion dollars worth of them? If printing presses were the key to prosperity, Zimbabwe could easily be the richest nation in the world.

NCPA

The National Center for Policy Analysis (NCPA) is writing about CALIFORNIA'S MEGA-BONDS.
Tired of exasperating traffic jams, aging schools and inadequate affordable housing, Californians have launched a new era of public works construction. California voters agreed Tuesday to finance the program by issuing $37.3 billion in bonds -- an amount greater than the annual spending of any other state.

As a growing federal budget deficit has eroded financial aid for highways and other projects, debates have simmered in recent years in state capitals about how to pay for them.

Critics say California voters made a mistake:
  • The borrowing will top $73 billion once the bonds are paid off with interest in 30 years, thrusting the state deeper into debt just as it is rebounding from the dot-com bust.
  • That could lead to cuts in funding for social services and other programs, they warn.
Supporters -- most prominently Gov. Arnold Schwarzenegger -- argue:
  • The benefits of highway and public transit improvements, better-equipped schools and reduced threats of flooding will be worth the cost.
  • That is especially true, they say, in a state predicted to swell by the population of Ohio over the next 10 years.
The four propositions will spend $19.9 billion on roads and public transit, $10.4 billion on school construction, $4.1 billion on levees and other flood-control projects and $2.9 billion on affordable housing.
The California Model

The Boston Herald dove off the deep end by proposing California’s $37.3 billion public works rebuilding program could be model for other states.
California voters agreed Tuesday to finance the program by issuing $37.3 billion in bonds - an amount greater than the annual spending of any other state.

“Voters said they are willing to bear the costs and are unwilling to wait for the feds to get their act together,” said Everett Ehrlich of the Center for Strategic and International Studies, a Washington think tank. “That California would see it in its best interest to go it alone and make such a sizable new investment in its future is in many ways new and different.”

Allan Zaremberg, president of the California Chamber of Commerce, said passage of the mega bonds will become a catalyst for discussions nationwide about funding infrastructure. “This is a real victory for people who have the economy in mind,” Zaremberg said. “Gridlock costs money. It’s really important to maintain our infrastructure.”
For starters voters most assuredly are NOT willing to bear the costs. Did California vote to live within their means? No, California rejected Proposition 76: The California Live Within Our Means Act. Did California vote for any tax hikes? Once again the answer is no. So where is the money going to come from? Future generations? Spending that pays for itself? A hope and a wing and a prayer? As for this being a "real victory for people" I would say that Zaremberg's ideas are downright dangerous.

California may have a model alright but that model is the road to ruin and bankruptcy.

Housing

The Desert Sun is writing Housing market drag on state until 2008.
The downturn in the housing industry will continue to depress the state's economy for most of next year before stabilizing in 2008, the Legislature's top budget analyst predicted Wednesday. Legislative Budget Analyst Elizabeth Hill forecast that residential construction will fall by 4.4 percent in 2006 and by an additional 13 percent in 2007. Then the analyst said it should stabilize with about 175,000 permits issued annually through 2012.

''I think the real story in terms of California's economy as well as the nation is what is happening in the real estate industry,'' Hill said. She noted that the real estate industry, which includes developers, contractors, real estate brokers, title companies and financial institutions, make up 15 percent to 20 percent of the state's private sector economy.

The slowdown in this industry was the largest single factor in a sharp decline in personal income growth, resulting in a drop in withholding tax payments from over ten percent in the first half of 2006 to less than five percent in the third quarter, Hill reported.

''California has been hard hit by what has happened in the overall real estate sector,'' she said. ''That is the main reason we see the softness in California's economy through 2007 and the rebound in 2008.''

Overall, Hill projected the state budget would end with a $3 billion reserve, but then run short by about $5 billion in each of the following two years and by $1.2 billion annually through 2012 without cuts, tax or fee increases or borrowing.

The current real estate slowdown also could affect state and local governments through what Hill called a ''more subdued'' growth in property tax revenues. The recent real estate boom led to a 35 percent increase in property tax revenue between and after adjusting for inflation.

Hill is forecasting that the annual growth in property taxes will drop from 12 percent in to below 6 percent in, and then rebound modestly.
The Landing

Once again we have a prediction that seems to amount to a soft landing. The landing will be anything but soft. In fact once the downdraft in California gets going people may be wondering if there will be a landing at all.

During the boom times no one pays down debt or saves for the future. That is because booms by nature are artificial. We had a boom based on easy money and shrinking credit standards. There is no way to pay down debt because the boom itself was based on an expansion of debt not genuine growth and savings. What extra tax revenue that did come in was wasted. Now here we are less than one year from the biggest housing boom in history and California somehow needed to float another $43 billion in bonds.

We produced an enormous housing bubble of unprecedented magnitude. What do we have to show for it? A GDP of 1.6% and sinking fast is what we have to show for it. It is taking more and more and more credit just to stand still.

Rest assured California is going to need even more bonds in the years to come (if they expect to keep spending money they do not have). The housing bubble has now popped but the consequences have only begun. The bottom is going to fall out of income and property tax collection. Unemployment is going to soar along with bankruptcies. In a state where one out of 50 working age adults is a real estate agent there is bound to be severe problems in a property bust.

Back in December of 2005 Tom McClintock writing for ChronWatch wrote about Arnold and the California Bond Bombshell.
Bonds are seductive. They promise immediate gratification but they conceal a heavy price. They are certainly the most expensive way to finance projects, costing two dollars to retire every dollar of debt. Moreover, the state’s borrowing capacity is finite, requiring careful attention to priorities, since debt once issued cannot be rescinded – only repaid. And every dollar borrowed by this generation reduces the ability of the next generation to meet its own needs.

Gov. Schwarzenegger is now dealing with the result. He must restore the public works built by a generation of giants while discharging a mountain of pointless debt racked up by a generation of spendthrifts. Only by rigorously applying these principles can he hope to do so.
Arnold has made a stand. He and the voters of California have agreed to float $43 billion in bonds on top of $30 billion or so in existing bonds. In effect the voters of California seem to think they got something for nothing. But life doesn't work that way. Given there is no realistic way to pay this debt back, California is headed for bankruptcy. No, don't expect an announcement tomorrow, or even next year, but the die has been cast.

Mike Shedlock / Mish
http://globaleconomicanalysis.blogspot.com/

Housing Industry Employment

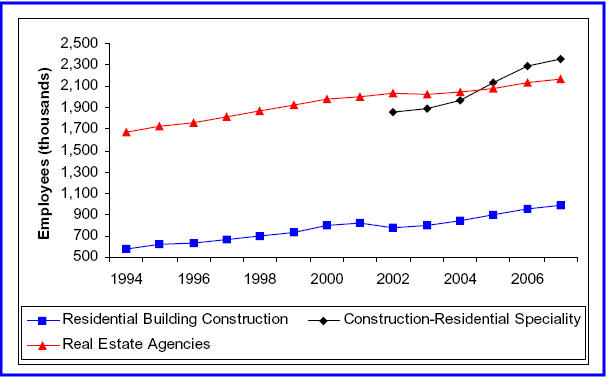
I came across an interesting graph of Housing Industry Employment in a Center for Economic and Policy Research (CEPR) PDF entitled Is the Housing Bubble Collapsing? 10 Economic Indicators to Watch.

The article was written in June of 2006 so most of the data it was watching (home sales, home prices, etc) is now far out of date. Last on the list of indicators to watch was employment. There it seem the party has just begun.

Industry Employment
Data produced by the Bureau of Labor Statistics


The jump in employment in the housing-related series over the last 13 years is a good measure of the impact of the housing bubble. While overall employment increased by less than 22 percent from the 1993 to 2006, employment in the construction of residential buildings increased by almost 70 percent. Employment in real estate agencies increased by almost 30 percent over this period. Employment in residential specialty trade contractors increased by almost 28 percent in just the years from 2001 to 2006.

When the bubble deflates, employment levels in these sectors will fall back in line with their historic patterns, as construction and sales levels move to more normal levels.

If employment in housing-related sectors were to fall back to levels consistent with their share of their labor force in the mid-1990s, it would lead a loss of close to 1 million jobs. If the construction sector temporarily falls below its normal level of activity as inventories of unsold homes adjust to normal levels, the job loss would be even greater.
In October Housing Starts, Permits, Foreclosures there was a discussion on housing employment, repeated below for convenience.

Housing Starts vs. Employment
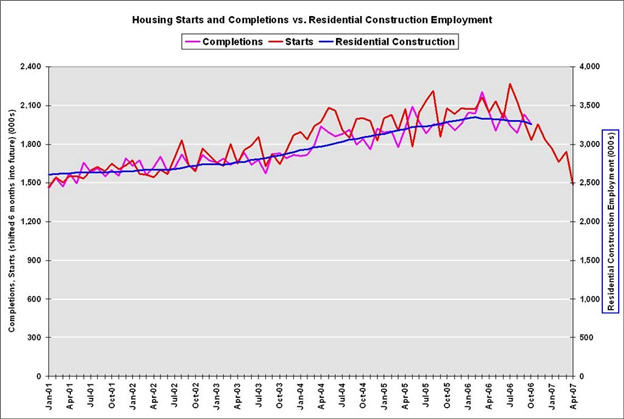
The following chart is courtesy of CalculatedRisk.
It shows residential construction employment vs. housing starts offset by six months.


Click on the chart for an easier to read view.

The chart above shows that although starts have plunged, completions remain high. This has ominous implications for construction jobs looking ahead. Given that employment will follow housing starts with a lag as existing construction completes, it appears that a minimum of 600,000 construction jobs will be lost over the next six months or so.

The ripple effect of the loss of those jobs, especially on consumer spending will be very noticeable. If anything, this may be a best case scenario on the unlikely assumption that starts and permits do not decline further. Note too that with the expected decline in consumer spending as a result of housing sector weakness, layoffs will likely cascade to a wide variety of other jobs especially restaurants and retail sales jobs.
Perhaps the above 600,000 jobs loss estimate was a bit on the optimistic side. Then again, perhaps those losses will take a lot longer to play out than the six month period as stated above. The bad news, however, is that the CEPR estimate of a potential 1,000,000 job loss assumes there will be no overshoot to the downside.

The CEPR estimate also does not address the ripple effect. On the way up, expansion in housing supported all sorts of retail activity like restaurants, nail salons, WalMarts, and Home Depots being built everywhere. The ripple effect ensures that job losses in those sectors will be magnified on the downside as well.

Mike Shedlock / Mish
http://globaleconomicanalysis.blogspot.com/
Sunday, 19 November 2006

October Housing Starts, Permits, Foreclosures

Was it just last month that Greenspan and David Lereah at the National Association of Realtors were declaring a bottom in housing?

That myth was shattered on November 17th when the Census Bureau released the Residential Construction Report for October 2006.

Building Permits
  • Building permits fell 6.3 percent to a seasonally adjusted annual rate of 1,535,000.
  • Building permits fell 28.0 percent from the October 2005 rate of 2,131,000.
  • Single-family authorizations in October were at a rate of 1,173,000. This is 3.8 percent below the September figure of 1,219,000.
Housing Starts
  • Housing starts fell 14.6 percent to a seasonally adjusted annual rate of 1,486,000.
  • Housing starts fell 27.4 percent from the October 2005 rate of 2,046,000.
  • Single family housing starts in October were at a rate of 1,177,000. This is 15.9 percent below the September figure of 1,400,000.
This was a record 9th consecutive decline in housing permits as well as the lowest permit total since December 1997. Housing permits are a leading indicator so a further deterioration of future economic activity is to be expected.

New Home Sales

Lereah was crowing about new home sales back on October 26 when Commerce Department reports showed “New-home sales in the U.S. unexpectedly rose for a second month in September as selling prices declined by the most since 1970. Purchases increased 5.3 percent to an annual pace of 1.075 million during the month from a 1.021 million rate in August. The median price of a new home dropped 9.7 percent from a year earlier, partly a result of more sales of homes priced less than $200,000 and fewer purchases of more expensive houses. “

New home sales may have risen in theory but in actual practice it is likely that sales declined considerably. The reason is that cancellations are not reflected in new home sales stats and cancellations have been soaring.

Cancellations
  • D.R. Horton (DHI) reported a cancellation rate of 40%, compared with 29% a year ago.
  • Meritage Homes (MTH) reported a 37% cancellation rate, compared with 21% a year ago.
  • Standard Pacific (SPF) reported a 50% cancellation rate compared with 18% a year ago.
  • The overall average cancellation rate for big builders was at 40%, about twice as high as last year's levels, according to the WSJ.
Bottom Calling

Lereah was not the only bottom caller in housing. When the the National Association of Home Builders/Wells Fargo Housing Market Index (HMI) "exploded" by three points from 30 to 33 in the last two months, NAHB spokesmen offered these comments just one day prior to the release of the disastrous October housing starts data.
“More and more builders are seeing light at the end of the tunnel,” said NAHB President David Pressly, a home builder from Statesville, N.C. “Our members are telling us that the market is steadying after a significant downward correction. On the demand side, we look for sales to stabilize and gradually move up in the coming months.”

“With home prices leveling off, mortgage interest rates remaining near historic lows, energy prices declining and the economy continuing to generate solid growth in employment and household income, affordability is now on the mend and many consumers recognize that home buying conditions have improved,” said NAHB Chief Economist David Seiders. “Builders are picking up on this change in market momentum.”
HMI Charts

What the NAHB did not say was that the HMI is a diffusion index and that readings under 50 show contraction. Is a move from 30 to 33 statistically relevant?

Kevin Depew on Minyanville answered that question way back on October 18th when at that time the HMI index exploded up by one full point. Please consider the following charts.


Thanks Kevin & Minyanville!

Foreclosures

RealtyTrac is reporting Foreclosures surpass 1 million mark in October.
“So far this year more than 1 million properties have entered some stage of foreclosure nationwide, up 27 percent from the same time last year,” said James J. Saccacio, chief executive officer of RealtyTrac.

“Monthly foreclosure filings were just below their high for the year, mirroring the trend from last year, when the most foreclosures of the year were also reported in October. Our data from the last three months shows that foreclosures are definitely trending upward, putting more pressure on an already strained housing market, and placing buyers and investors in the driver’s seat when it comes to negotiating home purchases.”
Foreclosures are actually close to historic lows, but the rate of change is ominous. Some of the bubble states like California are just now seeing an uptick because year over year home price appreciation was such that anyone having trouble making payments could escape simply by selling their home for a profit. With home prices no declining, mortgage rates resetting, and more home owners underwater that trend is about to change big time.

Housing Starts vs. Employment

The overall housing picture looks grim but is even worse than it looks, especially from an employment point of view. The following chart is courtesy of CalculatedRisk. It shows residential construction employment vs. housing starts offset by six months.


Click on the chart for an easier to read view.
Thanks CalculatedRisk!

The chart above shows that although starts have plunged, completions remain high. This has ominous implications for construction jobs looking ahead. Given that employment will follow housing starts with a lag as existing construction completes, it appears that a minimum of 600,000 construction jobs will be lost over the next six months or so.

The ripple effect of the loss of those jobs, especially on consumer spending will be very noticeable. If anything, this may be a best case scenario on the unlikely assumption that starts and permits do not decline further. Note too that with the expected decline in consumer spending as a result of housing sector weakness, layoffs will likely cascade to a wide variety of other jobs especially restaurants and retail sales jobs.

It remains to be seen if consumer spending ticks back up this Christmas season (I doubt it) but if it happens it will be the consumer’s last hurrah. A recession in 2007 is now all but guaranteed.

Mike Shedlock / Mish
http://globaleconomicanalysis.blogspot.com/
Friday, 17 November 2006

Red Tag Madness

Reuters is reporting California auto sales seen slowing through 2007.
Auto sales in California, the largest U.S. market for cars and trucks, will slow for the rest of this year and next, a forecast released on Thursday by the state's auto dealers association said. The report commissioned by the California Motor Car Dealers association forecast a 2.5 percent decline in 2007 sales.

"The reasons for the sliding market are plentiful, including slower economic growth, rising interest rates, elevated consumer debt levels and the slowdown in the housing market," the report prepared by consultancy Auto Outlook said. The California market is seen as a bellwether for national auto sales, which were down about 3 percent over the first 10 months of this year from the same period a year earlier.

In one standout trend, the California data showed the shift away from Detroit-based automakers and toward Toyota Motor Corp. has been more pronounced in the state than in the national market this year. Toyota's U.S. sales are up 12 percent so far this year, taking the Japanese automaker's share of the overall light vehicle market to 15.2 percent from 12.2 percent a year ago.

But in California, the most populous and wealthiest U.S. state, Toyota gained 3.7 percentage points of market share through the first three quarters, the study said.
By contrast, the traditional Big Three lost 4.7 market share points in California, the study said. On a combined basis, the Detroit automakers represented just 41.2 percent of auto sales in California through the first nine months, well below their 54.1 percent share nationally.
In PPI, Gold, and Dr. Copper I noted the following auto sector highlights.
Prices for light motor trucks fell 9.7 percent following a 3.5-percent gain in September. For 12 months ending October 2006 the index for light motor trucks fell 12.4%

Passenger car prices fell 2.3 percent in October compared with a 2.8-percent advance in September. For 12 months ending October 2006, the index for passenger cars decreased 3.2 percent.
Red Tag Event

GM has been trying to shy away from incentives, but it appears that rising inventories have forced GM's hand. The Detroit Free Press is reporting GM to launch clearance incentives.
General Motors Corp. will begin an incentive program this weekend to help clear inventories of 2006 models, three dealers told Bloomberg News.

The “Red Tag” event might cut prices on many ’06 GM vehicles and runs Nov. 18-Jan. 2, Manpreet Wadan sales manager of Bill Pierre Chevrolet in Seattle, told Bloomberg. GM will also allow dealers to discount many 2007 vehicles by $500 or more, he said.

Wadan said the Corvette, Pontiac Solstice, GMC Sierra pickup, Saturn Sky and all Hummer, Cadillac and Saab models.

Phil Vilar, a sales manager for San Diego-based Seaside Buick Pontiac GMC, told Bloomberg some of the details haven’t been decided, such as the full range of models and the distribution of discounts.

John McDonald, a GM spokesman, declined to comment on the incentives.
Dealer Comments

GM might not be commenting but a GM dealer on the Motley FOOL who posts under the name JediKnight is. This is what Jedi has to say:
In case any board members or lurkers are going to buy a GM car between now and Jan 2...

As part of the "Red Tag" sale, GM has given each dealer an allotment of "coupons", size of allotment is based on the size of dealer's inventory. The dealer has the option of using anywhere from $250, up to $2,000 per unit and it's NOT a rebate, it's dealer-cash meaning he doesn't have to tell you about it.

Yes, coupons are limited so if a dealer tells you that your particular unit of choice "doesn't" qualify for the money, he may be telling the truth. By tonight, all dealers must PRE-DETERMINE which specific units to use how much money on.

It's ridiculous. So if I 'roll the dice' and put $2000 on say, a 2007 white Denali and quote you a price, but now you want the black one ... I gotta raise my price to you. Isn't that pleasant for both sides?

I'm passing this along so that IF you go to your local dealer, you know about it.

Sure you'll know dealer cost, etc via your research, but ask the dealer to "show you which units he put the red-tag cash on ... he has a list WITH VIN numbers".

Mostly dealers will use them towards remaining 06's but you never know.

Asking this question could save you anywhere from $250 to $2000.
Thanks Jedi!

Once again GM is turning to the only method it knows to reduce inventories and move cars, and that of course is incentives.

The economy is clearly slowing and if there was any doubts then the October housing start numbers should put an end to that doubt. Look for incentives of all kinds to dramatically increase from both GM and Ford in 2007 as the consumer led recession of 2007 kicks in full force.

Mike Shedlock / Mish
http://globaleconomicanalysis.blogspot.com/

Wednesday, 15 November 2006

Lies, Deceit, Greed

I have been listening to the spin by NAR spokesman David Lereah. The contradictions are nothing sort of amazing.

In Looking for a Bottom on November 11th the Chicago Tribune quoted Lereah as saying:

1) "We need a price decline, we were overbloated"
2) "In 2007, it will be a flat year, maybe 1 percent [sales] drop, and that's it," "After 2007, we'll be back to expansion again."

Which is it, #1 or # 2? Or are we supposed to believe a 1% drop cures overbloatedness? Even if anyone was stupid enough to believe that a 1% drop cured overbloatedness exactly why wouldn't the promised expansion put us right back into overbloated territory again?

On November 13th in Realtors lament prices Lereah moans that home prices are too high.

1) "It's affordability – it's not just mortgage rates that make homes affordable, it's prices. I hope that as affordability starts to improve we see more first-time buyers again," Mr. Lereah said

Back on September 25th in U.S. Existing Home Sales Fall 0.5% in August Lereah said.

2) "We've been anticipating a price correction and now it's here. The price drop has stopped the bleeding for housing sales. We think the housing market has now hit bottom."

Once again is it #1 or is it #2?
If houses are not affordable then how have they hit bottom?
If housing has hit bottom then why do we need a decline to cure overbloating?

Inquiring minds may be wondering exactly what is in the punch that would cause 30,000 people to show up for a NAR annual meeting and listen to such nonsense. When did he call for that price correction anyway, and what evidence is there that the bleeding has stopped?

$40 Million Ad Blitz

Even though housing has bottomed a NAR ad blitz touts the housing market.
The National Association of Realtors is spending $40 million on full-page ads in the nation's biggest newspapers, including the Los Angeles Times, to convince people the market is A-OK.

"Don't delay," the ad says, urging readers to call Realtors, which represents 1.3 million brokers and agents.
If that ad proved anything it is the NAR is in a panic state and that housing has NOT bottomed. It was clearly a waste of $40 million dollars.

The theme of the ad campaign is
1) It's a great time to buy a home
2) It's a great time to sell a home

For the third time today I am asking is it #1 or is it #2?

Carrol Loyd in Don't Delay! Buy Or Sell Now! Right? writes:
This ad campaign seemed to come straight from the Mad Hatter's tea party.
How can it be a good time both to buy and to sell? Isn't that like saying it's a good time both to buy Microsoft and to sell Microsoft?
To answer Carol's questions: It' can't be good time to both buy and sell. As for the second question, given that one has to put up considerable margin to buy stocks but one can buy a home with 0% down it's hard to say exactly what it's like. For members of the NAR however, "It's [always] a great time to generate a commission."

NAHB Infomercials

Not to be outdone by the NAR, the National Association of Home Builders is making a package of "It's a Great Time to Buy" ready-to-use ads available to its members for free. Resources in the buy-now package include:
  • Talking points, Q&As and a sample press release
  • Sample op-eds, letter to the editor and newspaper columns
  • An economic backgrounder
  • Print and radio advertisements
  • Public relations advice on getting the message out through the media, events and Web sites
  • A home builders association guide on how to make the most of the package
  • Sample member communications, including a newsletter article and tips for engaging members in the campaign
A bunch of phony letter to the editor columns and "press releases" is just what we don't need. Those sample letters might be interesting but unfortunately they are available only to NAHB members. General consumer based propaganda from the NAHB can be found here.

Greed

The GlobeAndMail is reporting KB Homes CEO quits in stock option scandal.
Bruce Karatz, chairman and CEO of KB Homes, agreed to retire Sunday and repay the Los Angeles-based company $13-million (U.S.) after an internal report concluded the home construction company incorrectly reported stock option grants.

The company also announced the firing of Gary A. Ray, head of human resources, and the resignation of Richard B. Hirst, executive vice president and chief legal officer.

The KB review found the company used incorrect measurement dates for financial reporting purposes for yearly stock option grants from 1998 to 2005, the company said in a statement. As a result of the errors, KB expects a non-cash compensation expense of no more than $50-million. It said the errors may also require an increased tax provision.

Mr. Karatz was one of the highest-paid executives in 2005, making $155.9-million, mostly from exercising options, according to the Wall Street Journal. He had served as KB's CEO since 1986.

"I am extremely proud of everything that the entire KB team and I have accomplished over the past 20-plus years," Mr. Karatz said in a statement.
Wasn't $100-125 million enough for you Mr. Karatz?
PrudentBear had this comment:
"Since 1992, he has reaped nearly $180 million from exercising options. Last year, he made more than $150 million from salary, bonus, restricted stock grants and options exercises. The options exercises accounted for the bulk of his pay. The backdating appears to have begun in 1998, when Mr. Karatz received more than 450,000 options. That year also apparently marked a shift to much larger options awards — in each of several previous years, Mr. Karatz had received 100,000 options or fewer. His grants between 1998 and 2001 appeared particularly well-timed. In that period, he recorded one grant dated the day the stock touched its lowest closing price of the year, another at a quarterly low, and two more at monthly lows. One grant of 450,000 shares carried the date of Oct. 25, 1999, and an exercise price of $17.75, the year's lowest close."
Now, that's a track record to be proud of for sure.

Notes and Addendum.
The above originally appeared in Whiskey&Gunpowder on November 14.

Perhaps straight from the "Sample op-eds, letter to the editor and newspaper columns" from the NAHB "buy-now package" we see the following advertisement from a homebuilder presented as an opinion in the Asbury Park Press on November 15th:

Home buying a good investment in "down" cycle.
BY MARC J. SIEGEL
The homebuilders of New Jersey are still building and selling homes. The housing industry always has and continues to drive the local and state economy. Despite alarming reports of a "doom and gloom" market, real estate remains a solid, historically proven investment.

Contrary to what you have read, buying a new home is not a risky business. Since the national Savings and Loan crisis in the late 1980s, when banks failed as a result of overextended construction lending, a number of safeguards between builders and lending institutions have been established. These stringent regulations require banks to have sufficient net assets to protect themselves in the event of losses. Moreover, banks are exercising more fiscal caution and have established tighter credit guidelines.

In the 1980s, financial institutions were much more lenient in providing funding for "spec" houses under construction, but not yet sold. Today, residential builders may get financing only for the homes that are already under a sales contract and, thus, do not put themselves in a position of overextending financially with unsold inventory.
....
....
Not only can homebuyers remain confident about purchasing a newly constructed home, it's a buyer's market. There is no better time to buy a home than today. Prices are lower, interest rates are favorable and holding, and builders are more competitive.
....
Marc J. Siegel is president of the Shore Builders Association of Central New Jersey, Lakewood.
Much of what Siegel presents in regards to lending practices, credit guidelines, and spec building is easily refuted. Of course cancellation rates were not mentioned at all. Such writings do not belong on the opinion page but under the classified ad section.

Mike Shedlock / Mish
http://globaleconomicanalysis.blogspot.com/

Tuesday, 14 November 2006

The PPI, Gold, and Dr. Copper

On November 14 the BLS released the Producer Price Indexes for October 2006.

Weak September data was followed up by even weaker October data.

PPI Highlights
  • Prices for light motor trucks fell 9.7 percent following a 3.5-percent gain in September. For 12 months ending October 2006 the index for light motor trucks fell 12.4%
  • Passenger car prices fell 2.3 percent in October compared with a 2.8-percent advance in September. For 12 months ending October 2006, the index for passenger cars decreased 3.2 percent.
  • The index for finished energy goods declined 5.0 percent in October following an 8.4-percent drop in September.
  • Residential natural gas declined 9.3 percent following a 1.8-percent advance in September.
  • Gasoline prices decreased 7.9 percent after dropping 22.2 percent a month earlier.
  • Food prices fell 0.8%. This was the largest drop since May.
  • Computer prices dropped 3.1%.
I have been watching the intermediate vs. final PPI for quite some time.
Following is Chart A from the BLS report to consider:


In May, July, and August price pressures in intermediate and crude goods were not being passed on to finished goods. One possible interpretation was lack of pricing power (i.e. inability to pass on cost increases). The more common interpretation was that the PPI on finished goods was poised to explode up. There is no longer any doubt which interpretation was correct.

Marketwatch is reporting First back-to-back PPI decline since July 2004.
  • The producer price index fell a sharp 1.6%, which matches a record low set in October 2001, the Labor Department reported Tuesday.
  • The decline in the PPI pushed the year-over-year rate on finished-goods prices to negative 1.6%, the first time it has been below zero since September 2002.
  • The core PPI, which excludes food and energy costs, fell 0.9%, the biggest drop since August 1993.
Gold

Bloomberg is reporting Gold Prices Decline in New York on Easing Inflation Concerns.
Gold in New York fell for the third straight session after prices paid to U.S. producers matched the biggest monthly slide ever in October, reducing the precious metal's appeal as a hedge against inflation.

The 1.6 percent drop in prices paid to factories, farmers and other producers followed a 1.3 percent decline in September. Analysts expect the U.S. to report lower consumer prices on Nov. 16. Gold dropped 1.2 percent in the previous two sessions.

"There's no inflation.," said Marty McNeill, a trader at R.F. Lafferty Inc. in New York. "If the PPI is down, gold usually would go lower."
These writers need to brush up on history. Gold tends to do very poorly in disinflation but very well thank you in deflation. Gold shocked everyone when it rose along with the U.S. dollar in 2005. It will shock everyone again by rising along with treasuries when deflation sets in.

Dr. Copper

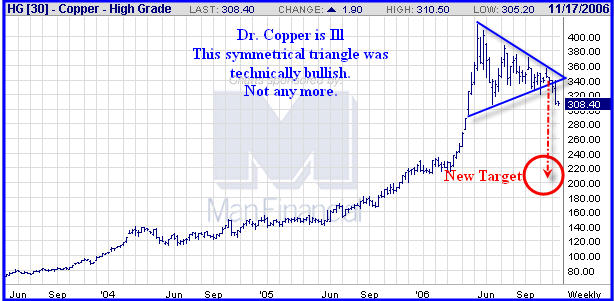
The bullish symmetrical triangle that had been forming on the weekly chart has now broken decisively to the south.


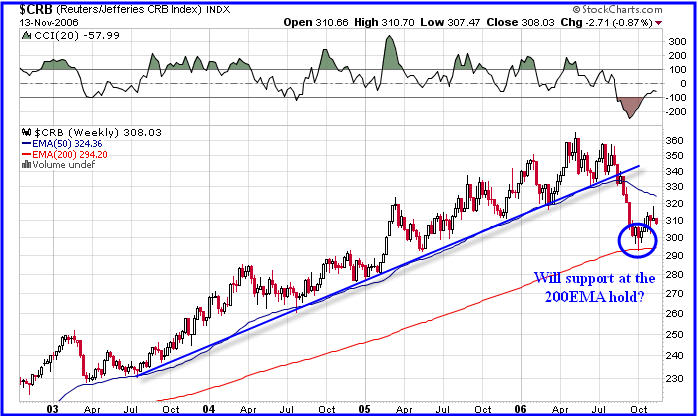
$CRB 200 EMA Bounce


The $CRB has put in a weak bounce off the 200 EMA.
Whether or not that bounce holds is likely to depend entirely on energy prices so let's take a look at a weekly chart of crude.


OPEC has dropped production and is considering further cuts in an attempt to defend oil prices. In the wake of a dramatically slowing worldwide economy, a successful move by OPEC to hold oil prices high would only increase recessionary pressures. Historically such actions have failed.

Along with a Plunging PPI, plunging copper, plunging home prices, plunging housing starts, a plunging GDP, and plunging consumer credit there should be no doubt which way the economy is headed. The only unanswered question is: When does the stock market get the message?

Mike Shedlock / Mish
http://globaleconomicanalysis.blogspot.com/

Saturday, 11 November 2006

Consumer Credit Plunges

I have been waiting for the consumer to cave in for many months now. Given past reversals in consumer spending one must question if the latest downturn is the real deal or just another outlier. In case you are wondering what I am talking about..... Here goes:

MarketWatch is reporting U.S. consumer credit down by most since April 1992
U.S. consumer credit outstanding fell by the biggest amount since April 1992 in September as households took out fewer loans for items like automobiles and boats, the Federal Reserve said Tuesday. Total consumer credit fell by $1.20 billion in September, or by a seasonally adjusted annual rate of 0.61%, to $2.366 trillion, the Fed said. In April 1992, outstanding consumer credit fell by $1.78 billion, according to the Fed.

The decline was unexpected. Wall Street economists surveyed by MarketWatch were expecting consumer credit to grow by $5.4 billion in September. Most of the decline was in so-called nonrevolving credit, like loans for cars and boats. Nonrevolving credit fell by $4.05 billion, or by a seasonally adjusted annual rate of 3.21%, to $1.50 billion.
UK Credit borrowing

Interestingly enough this downturn in consumer credit is not just a US phenomenon either. Forbes is reporting UK 2006 credit card borrowing to fall for first time since records began.
UK credit card borrowing is set to fall in 2006 for the first time since official Bank of England records began 19 years ago, a leading high street bank said.

In its latest borrowing monitor the Alliance & Leicester PLC found that the rate of growth in credit card borrowing has fallen every month since May 2005 from an annual rise of 11 pct to an annual decline in September of 3.2 pct. In fact, annual growth in credit card borrowing has been negative since May.

Overall, A&L found that total unsecured borrowing, which also includes loans unrelated to mortgages, is growing at its slowest rate for the last 13 years.

A&L said the growth in borrowing in the year to September has slowed to 1.4 pct a year -- compared with an average of over 10 pct over the last decade. It's also less than average earnings growth and all measures of price inflation.

What is more, it found that consumers intend to reduce their borrowing, further but despite all this, A&L downplayed the economic repercussions.

"We have not seen consumer borrowing this subdued since the recession of the early 1990s," said Chris Rhodes, Managing Director of Alliance & Leicester Retail Banking.
UK Consumer Debt

Firstrung.com is reporting UK Consumer debt is falling for the first time since the early 90's.

Highlights
  • Borrowing has slowed to just 1.4% a year compared to the level of an average of 11.7% over the last 10 years.
  • Borrowing is now falling in real terms for the first time since the early 1990s.
  • Credit card borrowing fell every month between February and August this year, the longest series of monthly falls on record.
  • Consumers intend to reduce their borrowing further. According to Alliance & Leicester's survey, people intending to reduce their credit card debt over the next six months outnumber those expecting to borrow more on their cards by a factor of five to one.
  • More than eight times as many people plan to reduce their other personal borrowing as those who intend to increase it.
Concern in Japan

Japan's Fiscal Policy Minister is Concerned About Weak Consumer Spending.
Nov. 10 (Bloomberg) -- Japan's Economic and Fiscal Policy Minister Hiroko Ota said she's concerned about weak consumer spending.Japan's economic growth probably failed to accelerate in the period, matching the slowest expansion since 2004, as bad weather and sluggish wage gains deterred shoppers.

The world's second-biggest economy grew at an annual 1 percent rate in the third quarter, according to the median forecast of 28 economists surveyed by Bloomberg News. Slow consumer spending, which accounts for more than half of the economy, may leave Japan vulnerable to a drop in global demand for autos and consumer electronics.
When was the last time we saw a simultaneous downturn in consumer spending in the U.S., the U.K., and Japan?

Black Friday Deals

Wal-Mart is responding with Black Friday Deals.
Black Friday discounts include a 42-inch Plasma HDTV for $998, $398 Compaq Presario desktop computer and more.

The world's largest retailer, already signaled its intention to be very price aggressive over the November-December gift-buying period by being be the first out of the gate to chop prices on toys and electronics. On Black Friday, the day after Thanksgiving, its deals get even lower.

CNNMoney.com first reported that Wal-Mart - after suffering some spooky October sales figures - wasn't waiting until Black Friday to unveil its holiday bargains and get people buying again at its discount stores.

Wal-Mart has already chopped prices on hot electronics and more than 80 toys. Some analysts speculate that Wal-Mart's rival Target could be pressured to match Wal-Mart's holiday prices although other merchants such as J.C. Penney might hold off on going head-to-head against Wal-Mart and set only moderate holiday discounts.
Wal-Mart has also announced We're not afraid to say Merry Christmas.
No. 1 retailer has decided to abandon its generic 'Happy Holidays' greeting in favor of 'Merry Christmas.' Wal-Mart has told its employees that it's OK to once again greet shoppers by saying "Merry Christmas" this holiday season instead of the generic "Happy Holidays."

CNN confirmed that Wal-Mart will announce Thursday that it plans to use the phrase "Merry Christmas" in products and around its stores this holiday season.
The results of this Christmas season's sales in the wake of deep discounts by Wal-Mart will be interesting to watch.

Golden Age of Finance

Although consumer credit is crucial, total credit is still keeping the wheels greased. Bloomberg is reporting U.S. Voters Approve Bonds by Boatload.
Welcome to the Golden Age of Public Finance.

That's the message voters sent to the municipal market yesterday, as they approved the majority of the record $78.6 billion in bonds placed on the ballot this year.

Voters in California approved all $43 billion in bonds they were asked to consider this year, and in the wee small hours looked poised to approve most of the $10 billion in local issues.

Of the $56.5 billion in bond issues totaling $200 million or more being considered nationwide, Bloomberg News this morning calculated that 97 percent had passed. The majority appear to be for education, the remainder, money to be used for infrastructure construction and maintenance.

The election of 2006 marks a watershed for the municipal market. Never before have voters had to consider so many bond issues. Never before had they approved so many.
Something for Nothing

Anyone voting in favor of those bonds wants something for nothing. Did voters think for one second about how all of this will be paid and what it truly means? The answer should be obvious. Californian's have no chance in hell to be able to afford this. Housing is slowing, there is an exodus of citizens from California, cities like San Diego are technically bankrupt, property taxes are capped, and the US economy is headed for a recession.

What California did is deeply immoral and economically suicidal to boot. But once again, as long as total toxic waste like this keeps getting a bid, things will appear to be OK. Inquiring minds may be asking "Who is buying this junk?" The answer is state and federal pension plans, all sorts of government bond funds, and hedge funds chasing yield without any regards as to risk.

Rest assured a massive "Credit Event" is coming. When it happens, no matter how bad it seems at the time, try to remember that it will be a good thing. Unless and until there is a total and complete repudiation of these excesses, the ultimate consequences will just keep rising. The sooner we have a debt purge the faster the recovery will be. Japan fought deflation for 18 years. Is the U.S. doomed to follow suit?

This topic was discussed Thursday evening on Howe Street in a podcast entitled "The votes are counted - Now what?" (A headline I blatantly stole from my favorite commodities trader Kevin Kerr).

No, this is NOT the golden age of financing, unless of course you have been investing in gold on account of it. Consumer credit did turn down, but the next question (assuming this is not an outlier) is: "Will total credit follow?" For a county so totally hooked on "borrow and spend" the consequences will be enormous when (not if) it happens.

This post originally appeared on Whiskey&Gunpowder. Sign up for free whiskey.

Mike Shedlock / Mish
http://globaleconomicanalysis.blogspot.com/