Thursday, 25 January 2007

Gold and the K-Cycle

This post is an attempt to explore the behavior of gold during each season in the Kondratieff Cycle. For newcomers, let's briefly review Kondratieff Cycle Theory.
The Kondratieff wave is about is a study of long cycles of debt buildup and repudiation. It is not exclusively about price inflation and deflation periods. Deflation is caused in part by the debt collapse. It is also a generational thing as the next cycle of debt buildup and collapse is renewed every 2-3 generations as the previous generation that went through comparable periods dies off.
Unlike others I do not think each season is fixed length nor do I think that a complete cycle is 54 years, but I am quite sure that we do go through four seasons and the seasons are generally long, from 15-25 years or so each.

Kondratieff Seasons

  • SPRING - Inflation
  • SUMMER - Stagflation
  • AUTUMN - Disinflation
  • WINTER - Deflation

Those descriptions do not exactly match those from the above link, but the ideas expressed are similar. Given that there are three seasons of positive inflation (disinflation is a positive but falling rate of inflation), by the time Winter approaches no one thinks deflation is remotely possible.

In order to make sense of pre-fiat gold prices, it is necessary to work out gold's "real price" from that period especially during deflationary eras. While perusing around for a historical chart that I could use, I stumbled on a chart of the CPI adjusted price of gold on sharelynx.com. The chart looked very familiar to me as a chart of interest rates. I asked Nick at sharelynx if he could take it back to 1920 and overlay the Fed Fund Rate on top of it. It wasn't anything he had tried before but he was happy to oblige. I then took his chart and added a few comments and a rough approximation of K-Cycle seasonality. Here is the result.

CPI Adjusted Gold vs. the Fed Fund Rate


(click on any chart for a better view)

Notice how the purchasing power of gold is inversely related to the Fed Fund Rate in Winter and Spring and directly related to the price of gold in Summer and Autumn. This is exactly as K-Cycle theory would suggest.

Spot Gold Prices


Those that thinks gold always acts as an inflation hedge are simply mistaken. One quick glance at the above chart should be proof enough. Did we experience inflation from 1980 to 2000? Did gold fall from over 800 to 250 anyway? Obviously the answer to both questions is yes, and that disproves the idea that gold is always some sort of inflation hedge. Yet the same statement is made by someone every day.

In Autumn, cash is trash and gold (like all currencies) are of little use. Asset prices like stocks and houses soar and everyone is spending every cent they have and then some, as fast as they can. A similar thing happened in the Roaring 20's and probably every other crack-up boom in history as well.

In the credit crunch of Winter deflation, gold and currencies are hoarded and the purchasing power of both rises. If anything, the CPI adjusted price as shown above during the Great Depression does not really do justice to the mammoth increase in assets such as land or stocks that gold could buy. Instead it reflects purchasing power on a general basket of goods and services. The same thing is likely to happen again.

This usually brings up the question of Japan and gold and why gold fell when Japan went into deflation. The answer is that Japan was one season out of sync with the entire rest of the world. When Japan was in deflation (Winter) the rest of the world was pretty much in disinflation (Autumn). It was the rest of the world that dictated what happened to the price of gold, not Japan.

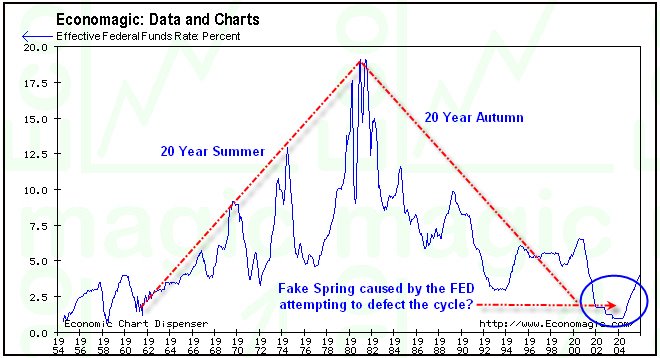
Note the two red ovals on the first chart on the far right. One of them is wrong. Gold is signaling deflation (at least by K-Cycle theory) but the Fed Funds Rate is not. What the chart does show is the "False Spring" reflation when the Fed acted too soon to prevent K-Winter by slashing interest rates to 1%. All the Fed really accomplished was the creation of an even bigger debt bubble that is going to have to be deflated away. This was the greatest currency experiment the world has ever seen. It will end in failure.

Every bubble sows the seeds of its own demise. Wages are not keeping up with ability to service debt. Global wage arbitrage and outsourcing ensures that trend will continue. Housing is not affordable and has risen several standard deviations beyond wage growth and rental costs. People purchased homes they could not afford just because someone was dumb enough to lend them money. The result is rising bankruptcies and foreclosures at a massive annual rate of growth. That liquidation has just now started.

To see how gold shares might act in the upcoming credit crunch, please consider a chart of Homestake Mining in the 1930's courtesy of Gold Eagle.


Fast forward to today.

Weekly $HUI


Weekly Gold


Comments

The December-January correction in gold appears to be over and a major move higher may have begun.

Even though the action from last year’s high in May has been volatile, the index has more-or-less moved sideways over the past year. This consolidation is a long-term bullish sign that suggests there is much more upside to the gold bull market.

Notice how the recent decline retraced only part of the rally from last October’s low. This may be the last dip before the HUI breaks out of this sideways consolidation for good.

Thanks to Gold Eagle and Sharelynx for the charts in this post.

Mike Shedlock / Mish
http://globaleconomicanalysis.blogspot.com/

Wednesday, 24 January 2007

Dimes, Bulldozers, & Volatility

Todd Harrison at Minyanville had some interesting thoughts about volatility today and I am pleased to be able to share them.

Here goes from Todd:

While I'm not the resident volatility expert in the 'Ville---that distinction belongs to the honorable Mr. Succo--I wanna further some thoughts that he's been discussing for some time.

Over the last few days, we've seen a very large seller of 5-year S&P puts. That's done two things: one, it put a bid to the market (the buyer of those puts must buy stocks as a hedge) and two--perhaps more importantly--it's depressed vols from already compressed levels.

The proliferation of "income funds" is a familiar topic to Minyans and, for us old schoolers, offering a sense of deja vu. I remember back during my Mother Morgan days, I had accounts selling "eighths" and "tinis" (1/8th's and 1/16th's) in size, collecting dimes in front of the bulldozer.

They made money for a few years, paving the way to a conditioned acceptance of this "free money" strategy. And then the bulldozer came in the form of a market decline, shutting most all of their doors.

This evolution--coupled with a distinct lack of hedging/protection--has vols, as measured by the VXO, at decade lows (which, ironically, was just about the time I left Morgan). And while part of the "vol crash" is a function of the sloshing liquidity (which is inversely related to volatility), there is a much more compelling story in our midst.

There aren't many of us left who remember what real volatility looks like. It is our hope that by reading the 'Ville, you'll be prepared for the squall when it arrives. For by the time you see it in the mainstream press, it'll be too late to proactively position yourself.
Thanks Toddo!

Here is a chart of the VXO to which Todd refers.
(Click on any chart in this post for a better view)


Perhaps volatility can go lower but it sure isn't going negative.

The appetite for risk is also shown in corporate bond yields. As long as yields keep compressing the stock market is likely to be firm. Following is the chart of Baa yields from Credit Swaps And Bond Yields.

Moody's Baa Bonds


Above chart by sharelynx.com.
Moody's Baa Bonds
Baa - Bonds and preferred stock which are rated Baa are considered as medium-grade obligations (i.e., they are neither highly protected nor poorly secured). Interest payments and principal security appear adequate for the present but certain protective elements may be lacking or may be characteristically unreliable over any great length of time. Such bonds lack outstanding investment characteristics and in fact have speculative characteristics as well.
Baa bonds are just one step above junk. Yields are close to 6%. You can get well over 5% on government backed CDs. Where is the risk reward?

Junk Spreads


The above chart is thanks to "orkrious" who posts on my board on Silicon Investor. The correlation is not perfect, nor is correlation the same as causation, but the stock market shows a tendency to sell off when yield spreads are widening. Note in particular the market selloff that started in May of this year just as spreads hit rock bottom.

These charts are not a sign of low risk but of a sign of willingness of investors to take nearly any risk to do better than the risk free returns on treasuries. Because of yield compression however, the size of the bets must increase to get the same actual returns. Think about that last sentence because it is part of what is driving insane increases in derivatives.

As yields compress the size of the bets (leverage) must increase to get the same returns. No one (especially me) knows when this is going to end, but betting on junk bonds, more yield compression, and/or betting on a further collapse in volatility is like picking up dimes in front of bulldozers.

Mike Shedlock / Mish
http://globaleconomicanalysis.blogspot.com/

Tuesday, 23 January 2007

Small Business Optimism & the Housing Recovery

On January 22nd the Chicago Tribune reported Small businesses profess optimism.
The Wells Fargo/Gallup fourth-quarter survey of small-business owners finds them the most optimistic in four years.

"While many economists are forecasting a weaker economic environment for 2007, small- business owners are, according to the results, expressing no signs of an economic downturn," said Scott Anderson, senior economist for the San Francisco bank.

"These optimistic findings indicate expectations for a rebound in activity this year, as the forces that have been inhibiting growth prospects, such as rising energy prices and interest rates and stagnant wage growth, reverse course."

The index set a record high of 114, up four points from the third quarter.

The quarterly index is calculated based on a nationwide survey of about 600 small-business owners conducted by the Gallup Organization and sponsored by Wells Fargo & Co.
That is interesting because the National Federation of Independent Business, the nation's leading small-business advocacy association suggests otherwise. On January 9th the Northern Trust reported on the NFIB Small Business Optimism Index.
The survey results from the small business sector are not encouraging. The Small Business Optimism Index fell to 96.5 in December, putting the annual average at 98.9, the lowest since the 2001 average of 98.4 when the economy was in a recession.


The pessimistic outlook of small businesses is visible in their response to capital expenditure plans. The Capital Expenditure Index fell to 26.0 in December, the lowest since August 2005.


The index tracking employment plans of small businesses dropped to 10.0, the lowest since March 2005. The main implication from the survey is that small businesses do not expect robust economic conditions in the near term.


One of those surveys is monstrously wrong and here's my take: If small businesses are really expanding now just as the economy is slowing, they are likely to regret it quickly unless their business is bankruptcy or foreclosure related.

Rose Mortgage Corp

Yet another lender bit the dust today.
RMC - Rose Mortgage Corp
EFFECTIVE IMMEDIATELY ROSE MORTGAGE CORPORATION IS CLOSED.

The Housing Recovery Coffin

Three more nails were put into the "Housing is Recovering" coffin today, by WCI, DHI, and DuPont.

DuPont Sees '07 Buffeted By Housing, Auto Slowing
On Tuesday, the country's second-largest chemicals maker threw some cold water on growing optimism that the housing market has started to rebound.

Headwinds from U.S. housing and automotive markets "turned out to be stronger than expected" during the fourth quarter, as customers reduced their inventory levels to adjust to a decline in housing starts, Chief Financial Officer Jeffrey Keefer told investors in a separate call.

The company forecast drags from lower activity in U.S. housing and automotive production continuing this year, as new residential housing demand falls in the first half from the year-ago period and sluggish auto output cuts into first-quarter earnings.
In a stunning achievement WCI reported More Cancellations Than Orders for the entire 4th quarter. Nicely done WCI.
"Results for the fourth quarter will be below prior expectations due to a higher level of defaults than expected in both our Traditional Homebuilding and Tower Homebuilding operations, longer tower construction cycles, and the recording of significant impairments and write-offs," said Jerry Starkey, President and CEO of WCI Communities.

The company expected to close 621 traditional homes in the fourth quarter and actually closed 434 at an average price of approximately $760,000 while recording 187 defaults. Preliminary combined tower and traditional gross new orders totaled 261 for the fourth quarter but were offset by a combined total of 270 tower defaults and traditional home cancellations and defaults.

D.R. Horton Inc. (DHI) Chief Executive Don Tomnitz believes the housing industry is still in the "early stages" of its slowdown.
"Most downturns are longer and deeper (than people expect), and we are not seeing anything on the horizon to change that opinion," Tomnitz said during a conference call Tuesday to discuss the company's fiscal first-quarter earnings.

Tomnitz, who has weathered through three other housing downturns in the past 23 years prior to this one, said he expects the housing sector to remain "challenging" through at least fiscal 2007.

He said he expects it will take two to three quarters before the sector "bottoms out." After that, he said, he doesn't see a sharp rebound. "We're not expecting any rapid improvement" after that, he said. "It will be flat to slightly up in 2008."

The CEO's comments come as D.R. Horton reported a 65% earnings decline and took land-related writedowns of $77.7 million in the company's fiscal first quarter that ended Dec. 31.
A Surefire Investment

The St. Petersburg Times is reporting Loan deals on shaky ground.
Construction Compliance Inc. promised surefire investment homes with no money down. St. Petersburg's CCI would build houses on scattered lots from Hernando to Lee counties. Customers could resell them for a profit without spending a dime.

But the housing downturn has a way of spoiling best-laid plans. Not only has CCI ceased construction on scores of homes, but customers also have been left with half-built shells on which subcontractors are demanding payment.

The banking world is also feeling the shock. Bradenton's Coast Financial Holdings Inc., parent of Coast Bank, announced Friday that 482 mortgage loans made through a single builder were at risk. The bank didn't specify CCI in its filings; however, buyers and their attorneys have since confirmed its identity.

Within hours of the announcement, Coast's stock had plunged, closing down 28 percent Monday. If CCI collapses, individual borrowers have an obligation to meet their mortgage payments, though Coast suggested that some might default in light of the no-money-down deals they were promised.
Well toss another "surefire" investment scheme on the ash heap of history. This mess is really just beginning to unravel. More lenders are going to go bust and borrowers are going to be on the hook for unfinished condo towers and homes. A monument to the stupidity of it all is likely to be be half finished condo towers blighting Miami and other cities for years to come.

Mike Shedlock / Mish
http://globaleconomicanalysis.blogspot.com/

Monday, 22 January 2007

Gold, M3, and Willingness to Lend

Let's start with a quick look at the expansion of the monetary base in comparison to the expansion of broad money supply as measured by M3.

Monetary Base


M3


The above chart is from a discussion on Money Supply and Recessions. For this article, pay attention to the green line, ignoring the others. M3 started exploding in 1971 and it was not happenstance either. Here is a snip from The Last Great Bubble - Counterfeiting the Dollar.
1971 - Aug 15 - President Nixon closes the international gold window. U.S. Dollars are no longer redeemable in gold for international settlements. This marked the beginning of the current, anchorless floating currency regime, an not coincidentally, a decade of inflation.
The previous link is an interesting read from 2002 predicting the demise of the dollar even as it was still rising at the time. However, the article fails to point out that it was not just the US abandoning all ties to the gold standard, it was every country in the world.

This was the biggest experiment in fiscal madness the world has ever seen. Unleashed from the "burden" of gold redemptions, credit has soared far faster than base money supply. This in turn fueled asset bubble after asset bubble, but most notably in the global equity markets and housing.

Do those charts represent inflation? Absolutely, what else can they represent? Inflation is the expansion of money and credit and both money and credit went on a tear. But although the chart patterns are similar, the scale is enormously different. M3 dwarfs monetary base expansion.

There is without a doubt a bubble in credit. Money is being "swept" out of checking accounts and lent out. Bank reserves are non-existent. Fannie Mae and Freddie Mac have been creating debt out of thin air. That is what happens when money is no longer backed by anything. But the question is not "What happened?", as the charts clearly show that. The pertinent question is "What happens next?" As long as asset prices keep rising the bubble can keep expanding. Consumers can then keep borrowing against the rising value of their houses and stocks which in turn supports current consumption.

Is the ability to expand that credit bubble infinite?

I think not. Therein lies the problem. Every bubble sows the seeds of its own demise. Wages are not keeping up with ability to service debt. Global wage arbitrage and outsourcing ensures that trend will continue. Housing is not affordable and has risen several standard deviations beyond wage growth and rental costs. People purchased homes they could not afford just because someone was dumb enough to lend them money. The result is rising bankruptcies and foreclosures at a massive annual rate of growth.

Can the Fed keep expanding the bubble?
Once again the answer is no. Debt bubbles end when the central bank is no longer able or willing to extend credit and/or when consumers and businesses are no longer willing to borrow because further expansion and /or speculation no longer makes any economic sense.

Here is an alternative reason: Debt bubbles implode when the ability to service the debt can no longer be maintained. Bankruptcies and foreclosures are two ways to measure inability to service debt.

Foreclosures

Foreclosures are actually at a fairly low rate. It is the rate of change however that is alarming. Foreclosures increase 51 percent nationwide.
Foreclosures increased 94 percent last year to 157,417 homes in California, as homeowners struggle with fast-rising home payments and a slow-selling market, according to a Fair Oaks real estate investment advisory firm on Monday. California had the most foreclosures filed nationwide, while Nevada had the largest percentage increase at 175 percent last year compared to 2005, according to Foreclosures.com. Nationwide, almost 971,000 foreclosure filings were reported last year, 51 percent more than the 641,000 in 2005, according to the annual report.
Faith In The Fed

Right now there is enormous faith in the ability of the Fed to keep the bubble inflated. Inflationists fail to see that much of that credit borrowed into existence can never be paid back.

Yet somehow everyone thinks the Fed will expand money enough to matter if a credit bust happens. It has never worked that way in history. Take a good hard look at monetary base vs. M3. Interest rate policy at the Fed can not fuel that expansion forever.

The Treasury Department has massive ability to print money but it can not force banks to lend. It is important to understand the difference. Credit lending standards can only go far so far before bankruptcies and foreclosures force a change. That change is finally upon us and a huge secular reversal is now underway.

The Fed itself simply does not have the power to deposit money into consumer accounts so that bills can be paid. They probably would not do so even if they could because it would be to the detriment of banks and creditors. Will the Fed react to a debt implosion by cutting interest rates? Absolutely. The Fed is will likely attempt anything they can to help consumers service debt. History proves it and history proves gold will benefit as well. But the Fed can not create jobs or revive housing and neither can the Treasury.

Willingness To Lend

The Mortgage Lender Implode-O-Meter is reporting “Twelve lenders have now gone caput since December 2006”. This number has has been increasing at a rate of 1-2 a week since December. Two of those lenders were among the top twenty subprime lenders. One of them was Ownit Mortgage, the other was Mortgage Lender Network. Ownit Mortgage and MLN both went bankrupt.

Following is a partial list of lenders unable (via bankruptcy) or unwilling (because of huge losses) to make subprime loans.

2007-01-19: EquiBanc
Wachovia recently conducted an intensive strategic review of its mortgage business which has altered the company's approach to the origination of non-conforming loans. As a result, Wachovia has elected to close EquiBanc Mortgage - Wachovia's only business dedicated solely to non-conforming loans.
2007-01-19: FundingAmerica
Due to current market conditions in the mortgage industry, Funding America has decided to discontinue accepting any new business.
2007-01-08: Clear Choice Financial/Bay Capital
Clear Choice Financial, Inc. a Nevada corporation, announced that it is insolvent and in default on numerous obligations. Clear Choice has officially closed the mortgage lending offices of its wholly owned subsidiary, Bay Capital, located in Owings Mills, Maryland and Irvine, California.
2007-01-05: SecuredFunding
Based upon market conditions and limited product availability, we are ceasing wholesale operations. We have stopped accepting new applications, and will have until the 12th of January to fund out the pipeline. We appreciate your patience as we undergo this transition.
2006-12-29: MLN
Hundreds of workers in Rocky Hill left the office of a billion-dollar national company with boxes in hand and tears in their eyes. Mortgage Lender's Network, headquartered in Middletown, recently stopped funding new loans. "We're not going to get paid. We keep our benefits for two weeks, and we're not going to have a severance package." said MLN employee Melissa Goyette. The company is closing after losing a large financial backer and the failure of a last-minute bid to raise cash. The company was in the middle of building a new location in Wallingford that was to open later in the year.
2006-12-20: Harbourton Mortgage Investment Corporation
Harbourton Capital Group, Inc. announced that effective December 20, 2006, Harbourton Mortgage Investment Corporation (“HMIC”), its wholly owned mortgage-banking subsidiary, ceased funding new mortgage loans and initiated a process to wind down its operations. HMIC was forced to take these actions when it was unable to satisfactorily resolve mortgage repurchase claims asserted by selected investors that had purchased mortgage loans from HMIC. As a result of this action, HCG will likely write off its full investment in HMIC. HMIC’s recent ignificant losses and requirements for new capital negatively impacted HCG during 2006.
Eligible Buyer Pool

The pool of eligible buyers is now shrinking. Consider the article For credit risks, home loans harder to get. Here are some excerpts regarding changes in lending standards:
  • Down Payments: New guidelines require 10 percent down according to Gary Akright, a mortgage broker at Dominion Mortgage Corp. The previous guidelines required 5 percent down.
  • Credit scores: Previously, borrowers with a FICO credit score as low as 570 (out of 850) could qualify for a single loan financing 100 percent of their home purchase, Mr. Carmona of Homewood Mortgage in Carrollton said. "Now, across the board, it's jumped up to a 600 FICO score for an 80/20 loan".
  • Subprime Rates: Rates on subprime mortgages have risen about a full percentage point since September, Mr. Carmona said, while regular mortgage rates have been relatively steady.
  • Savings requirements: "They want to see borrowers have at least three months of reserves in their account in case of an emergency," Mr. Carmona said. "They want to see it in your bank account saved for at least 60 days. Usually, subprime lenders didn't ask for that."
Current Conditions vs. 70's and 80's

Conditions now are radically different than conditions in the 70's and 80's. A couple decades ago households went from one wage earner to two wage earners which increased purchasing power; wages and benefits were rising and not just for those at the top end; mortgage rates were set to decline nine full points; credit lending standards had plenty of room to drop; debt levels were low; the savings rate was high, and ability to take on debt was huge. Virtually none of those conditions exist today, not a single one. Yet many think that because commodity prices are rising that this is some sort of 70's and 80's replay. It simply can not be. The conditions are vastly different.

Willingness to Lend / Willingness to Borrow
  • Credit standards are tightening
  • The pool of willing lenders is clearly shrinking
  • The pool of eligible home buyers is now shrinking with the tightening of credit standards
  • The pool of willing buyers is shrinking along with a decrease in the willingness to speculate on housing
The psychology of both lenders and borrowers has now changed at the margin (subprime lending). This is how cascades start. When defaults continue it will progress further and further up the chains of credit worthiness. It is a mistake to think this will be confined to housing. It won't. If and when another huge hedge fund blowup, and/or there is a huge junk bond default, the leveraged buyout and merger mania markets will be hit hard. This is all poised to feed on itself once the ball gets rolling. A major credit bust is coming and it is only a matter of time.

There is massive belief in the Fed to be able to do something about that bust when it happens. That faith is totally unwarranted. Note again the huge difference between M3 and Base money. Also note that the Fed can not create jobs or put money directly into consumer accounts. Even if the Fed could deposit money into consumers pockets (the helicopter drop theory), to do so would be at the expense of banks and creditors. That makes the helicopter drop scenario implausible. However, the Fed will undoubtedly be willing to slash rates. But will banks be able and willing to lend? Will consumers be able and willing to borrow? A history of credit bubble collapses suggests otherwise as does the data presented above.

Mike Shedlock / Mish
http://globaleconomicanalysis.blogspot.com/

Cold Weather Forecast thru Mid-February

Following are some weather maps and weather related commentary courtesy of wxrisk.com. Someone sent these details to me and I thought I would pass them on. WxRisk seems to be a good site for weather related details.
Short Range January 22-23

It was a cold morning over the Plains.... with temps single digits and some below zero readings as well... and these below zero readings reached into all of CO and WY. The Midwest was not nearly as cold.

If you saw the BEARS vs. SAINTS playoff game late Sunday afternoon - early evening then you saw the heavy snow showers over Chicago. That was part of a new Arctic cold front that was sweeping through the Midwest and headed for the East coast. That front will arrive Tuesday and bring in a reinforcing shot of cold air -- Below Normal -- to the Northeast Quadrant -- the NE and ECB area combined -- for Tuesday and Wednesday. The heart of this cold air will NOT affect the Plains or Deep South. Those area will certainly NOT be mild but not nearly as cold as the Great Lakes and Northeast either.

On the West coast the strong Ridge in the Jet stream holds all this week so most of the West coast will stay mild / warm and dry even in the Pacific NW. By next Sunday the model show that ridge getting MUCH stronger which has major implications for the eastern half of the continental US in week 2.

Medium Range January 24 - 28

If you recall from late last week last SOME of the weather Models were showing a major Low developing on the East coast that could bring heavy snow and High winds to that area. As I stated last week the development of a POSSIBLE major Low for Jan 25 is going to be essential for keeping the trough over the eastern continental US in place. With No BIG Low off the East coast that moves into Eastern Canada the trough would slide East and the cold pattern over the Eastern US would weaken or break down.

Over the weekend all of the model data shows that Low will develop JAN 24-25 as a NEW arctic front drives into the Midwest and East coast. The Low that develops Jan 25 is going to be too far off the East coast to bring the big cities of the NE a snowstorm but it WILL form. The Low will undergo massive deepening as it moves in East Canada. The North winds created by this Low will be very strong...40 + MPH over the entire East coast.... on Friday ... so the wind chill be well shocking .

If there are energy traders in the Northeast continental US there that still doubt this new cold pattern will last... well this should make them think twice
By next Saturday and Sunday a NEW arctic HIGH will be driving S and E from south central Canada into the Plains and Midwest.

January 29 - February 3

The arctic HIGH that comes down JAN 27-28 drops into OK then slides east across the Deep South. This means the cold air mass over the Plains and Midwest will warm quickly and the Mild temps will move into the East coast for a day. BUT yet another Arctic HIGH will be dropping south from western and central Canada. The Next front sweeps East through the Plains and Midwest Jan 30 and reaches the East coast JAN 31

As long as that western North America Ridge stays strong and big over western Canada there will be NO shortage of cold fronts coming down. The cold pattern looks locked in into Mid FEB.

The reasoning can be seen below. The Map on the left side in the European Jet stream map for Day 8-9-10 and the map on the right hand side is the American weather model Jet stream map for Day 8-9-10.


Notice that BOTH maps show a HUGE ridge that extended way north past Alaska into the Arctic circle. Then note how those black lines PLUNGE from that ridge all the way into central and eastern continental US. That is a cold cold map folks.
The above commentary and chart are courtesy of wxrisk.com. A more detailed version of the above weather map can be found at http://www.wxrisk.com/MODELFOLDERS/today/test8.gif

If the above weather scenario plays out and energy can not rally now, the implications should be obvious.

Mike Shedlock / Mish
http://globaleconomicanalysis.blogspot.com/

Sunday, 21 January 2007

World Oil Demand

Findfacts is showing that Oil demand falls in Developed World for first time in 20 years.
Data issued by the Paris-based International Energy Agency (IEA), the energy watchdog of the industrialized countries including Ireland, show oil consumption in the 30 member countries of the Organization for Economic Cooperation and Development fell 0.6% in 2006. While the fall appears small, it marks the first annual drop in more than 20 years among the OECD countries, which use close to 60% of the 84.4 million barrels of oil used globally each day.

The fall in oil use by the industrialized world is a sign that the reactions to higher oil prices by businesses and consumers from the US to Germany to Japan may be adding up to a cycle-turning downdraft in demand. The resulting shift in global cash flows could mean a big boost for oil consumers' economies at the expense of producers and exporters. Other signals, both economic and psychological, have been popping up for some time: Demand for gas-guzzling sport-utility vehicles has been falling, while investment in and sales of alternative fuels such as ethanol are booming. Even the Bush administration is vowing to reduce America's dependence on crude.

Crude oil's fall to $50 a barrel may push US gasoline pump prices below $2 a gallon for the first time in more than two years, based on historical price moves. The last time the average price for regular gasoline was below $2 was in March 2005, according to the AAA, the largest U.S. motorist organization. Prices are already below $2 in some parts of the country, including Oklahoma City and Kansas City, Missouri.
Here are some charts to consider from the Energy Information Administration.

World Oil Demand


Oil Consumption


The above charts show that for now, total world oil demand simply is not expanding as fast as some lead us to believe. However, the rate of growth in China and Other Asia is substantial.

Long Term Trendline on Crude


Short term a bounce in crude off the 200MA is likely to happen. Seasonally a bounce might also be expected here, especially if the unusually warm weather turns harsh. Intermediate term we have a recession to deal with. Long term we also have to deal with peak oil. There are also tremendous geopolitical factors. Will Bush order an attack on Iran? Will Israel attack Iran? Will Iran be able to block the Strait of Hormuz effectively shutting down all Mideast oil? Just how stable is Saudi Arabia? The only one of those questions that can easily be answered is that Iran is unlikely to be able to block the Strait of Hormuz, but that does not imply that the world will be able to do without oil from Iran itself.

What we do know for sure is that oil demand fell for the first time in 20 years and that can not be signaling much of anything other than a global slowdown. Price is set at the margin and demand at the margin has declined. What we certainly do no know is most everything else including how much geopolitical tension is priced in or out.

Long term I believe in peak oil.
Long term I also believe the market (if left alone) will find a nice solution to peak oil.

One of the problems right now is the inability of those in power to let the market decide what to do. Instead we have seen absurd subsidies for ethanol, a stupid war in Iraq, a willingness to attack Iran, and a whole host of other nonsense outside the US including Chavez nationalizing oil in Venezuela. Furthermore we do not know the full extent of how much hedge funds have driven up the price of oil based on the above knowledge, nor can we really trust any source of information about oil from Saudi Arabia or the Mideast in general.

I was willing to take a stand on copper based on sinking housing demand, but this is way more difficult. I was quite bearish on crude above $75 but near $50 and bouncing off a 200MA the call is much more difficult.

For those that insist on a call, here it is. I expect a short term bounce off the 200MA then a fall to the $40-$50 range for a long basing action, followed by a blast higher. I reserve the right to immediately change my opinion without notice based on current events.

Note: This post is an opinion only and can not be construed as investment advice of any kind. Please consult your investment adviser before taking action on this or any other post you see here or elsewhere.

Mike Shedlock / Mish
http://globaleconomicanalysis.blogspot.com/

Friday, 19 January 2007

Credit Swaps And Bond Yields

Moody's is reporting Bonds Safest in at Least 4 Years, Credit Swaps Show.
By Shannon D. Harrington

The risk of owning corporate debt is the lowest in at least four years after housing data bolstered confidence that the worst of the residential real estate slump is over, according to traders who bet on corporate creditworthiness in the credit-default swap market.

"There's some optimism that credit quality will continue to remain strong and default rates will remain low," said Ira Jersey, a strategist at Credit Suisse in New York. "Homebuilders did pretty well because of housing starts and permit numbers. Certainly, with the jobless claims being low, people will have money to spend."

Credit-default swaps on homebuilders fell to the lowest in more than eight months as housing data lifted confidence that home sales are rebounding from last year's 18 percent drop, the worst plunge since 1990. A decline in the price of credit-default swap suggests improving perceptions of credit quality.

Contracts on $10 million in bonds of D.R. Horton Inc., the biggest U.S. homebuilder, fell to $65,100 from $73,000 Jan 12, CMA Datavision prices show. The price is the lowest since May.

"A lot of people are calling for the bottom of the market, and by mid-2007 we should see some sort of recovery," said CreditSights Inc. analyst Sarah Rowin in New York. "Although earnings are going to be down, the builders could come off relatively intact."

CDO Sales

The derivatives helped CDO sales surge last year to a record $497.1 billion, 81 percent more than in 2005, Morgan Stanley analysts said this month. The funds, which are sliced up according to risk and sold as bonds, appeal to investors because they can offer higher yields than the assets being pooled.

Credit-default swaps, which were conceived to protect bondholders against default and pay the buyer face value in exchange for the securities if a company does default, have become one of the best gauges of shifts in credit quality.

An estimated $26 trillion in the contracts are outstanding, the International Swaps and Derivatives Association said in September. Derivatives are financial instruments derived from stocks, bonds, loans, currencies and commodities, or linked to specific events like changes in the weather or interest rates.
Let's see if we can take this apart piece by piece.

Shannon Harrington: "The risk of owning corporate debt is the lowest in at least four years."

Mish: No the "risk" is not the lowest. Yield spreads have compressed because the willingness to take on risk is at its highest point in at least four years. Spreads between junk and investment grade debt have collapsed. Do not confuse optimism with risk. An inverted yield curve suggests this optimism is not warranted, nor is the bounce in housing starts that significant. This all reminds me of the continued optimism in JDSU and CIEN in the Nazcrash of 2001 before they eventually lost over 90% of their value.

Ira Jersey: "There's some optimism that credit quality will continue to remain strong and default rates will remain low. Certainly, with the jobless claims being low, people will have money to spend."

Mish: Well you certainly have that optimism part right but you are confusing jobless claims with money to spend. A negative savings rate for 18 consecutive months suggests that consumers are spending money they do not have. Also note that we are continuing to lose high paying manufacturing jobs for low paying jobs at Walmart and Pizza hut. Also note that Mortgage Equity Withdrawal (MEW) is drying up as a source of funding. That is less money in pockets to spend. Finally, even IF consumers had more money to spend, at some point they will stop spending it. Debt burdens are at an all time high. That debt must be paid off. For spending to dramatically rise, both jobs and wages (not just for the fat cats) have to rise. That is not happening as global wage arbitrage and outsourcing continues unabated.

Shannon Harrington: "A decline in the price of credit-default swap suggests improving perceptions of credit quality."

Mish: Exactly. Please do not confuse perceptions with reality. Do not confuse perceptions with risk either.

Sarah Rowin: "A lot of people are calling for the bottom of the market, and by mid-2007 we should see some sort of recovery. Although earnings are going to be down, the builders could come off relatively intact."

Mish: Does bottom calling mean it will happen or does it represent unwarranted optimism? How many bottom calls were there when the Naz started plunging from the peak over 5000? Has anyone bothered to look at cash and inventory levels on homebuilders? Sarah, please take a look at homebuilder corporate statements. They are running out of both cash and profits, while inventories are soaring.

Morgan Stanley: CDO sales surged last year to a record $497.1 billion, 81 percent more than in 2005. The funds, which are sliced up according to risk and sold as bonds, appeal to investors because they can offer higher yields than the assets being pooled.

Mish: We will take a look at the "appeal" of higher yields in a chart below.

International Swaps: An estimated $26 trillion in the contracts are outstanding, the International Swaps and Derivatives Association said in September.

Mish: Wow. On the theory that "the bigger the bet the safer things must be" this must be a sure sign that "Corporate Bonds Are Safe".

Let's take a look at a chart of Moody's Baa Corporate Bonds to see what it might be saying.

Moody's Baa Bonds


Above chart by sharelynx.com.
Moody's Baa Bonds
Baa - Bonds and preferred stock which are rated Baa are considered as medium-grade obligations (i.e., they are neither highly protected nor poorly secured). Interest payments and principal security appear adequate for the present but certain protective elements may be lacking or may be characteristically unreliable over any great length of time. Such bonds lack outstanding investment characteristics and in fact have speculative characteristics as well.
Baa bonds are just one step above junk. Yields are close to 6%.

Bank Deals - Best Rates shows that you can get up 6.19% for 6 months at some places. Hmmm. Lets see, do you want 6.19% on a 100% guaranteed bet or approximately the same thing on bonds rated one step above junk? Inquiring minds want to know what if anything is "appealing" about the risk/reward shown in that chart.

On that thought the Mish telepathic question lines are open. Hmmm. I am being flooded with calls. Fortunately the ideas expressed are all similar. They go something like this. "Mish, you are trashing corporate bonds at a mere 6% or so but if I recall correctly you like 10 year treasuries that yield even less. Please explain"

10 Year Treasuries


Above chart by sharelynx.com, modified by Mish.

Some newcomers might be confused about the seasons on the above chart. Those seasons correspond to something called the K-Cycle. K-Cycles are long. The last K-cycle Autumn peak was in 1929. That was followed by the great depression. With companies going bankrupt in the early 1930's the last place you wanted to be was in corporate bonds. Those in treasuries did great. Safety vs. "perceived safety" is the key. Although I am not calling for another depression, I am merely pointing out that the economic conditions are very similar. This case was presented in 1929 Revisited.

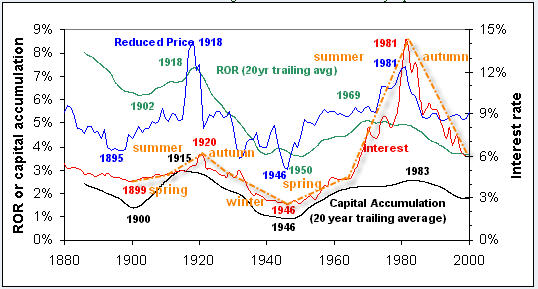
Interest Rate Interpretation of the K-Cycle


K-Cycle longer term view


If we are headed into "winter" the last place you want to be is in junk bonds. Even if we are not headed into "winter" where is the risk/reward for junk bonds when you can get nearly the same yields in CDs?

No matter how you slice it, credit swaps have pushed corporate yield spreads far into the blatantly complacent level where risk is enormous and rewards are slim. That is exactly the opposite of what Shannon Harrington is suggesting.

Mike Shedlock / Mish
http://globaleconomicanalysis.blogspot.com/