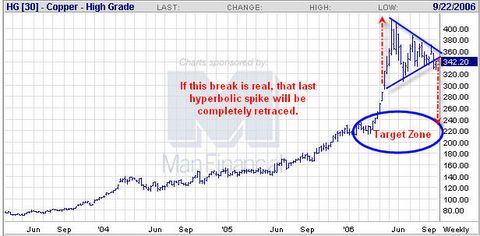
I proposed copper was about to break down. Technically that near perfect symetrical triangle is a continuation pattern which in this case would be a bullish formation.
OK Mish, so why the "?" assuming down?
That’s a good question and enquiring minds deserve answers. Here goes:
- One of the biggest uses of copper is housing and housing has clearly fallen off a cliff
- Copper went into contango
It seems I am not the only person watching copper. Greg Weldon at Weldon Financial posted the following charts on Minyanville on September 21.

In reference to the above chart Greg Weldon wrote:
I still believe that Copper simply cannot ‘escape’ the horror-show that has become the US Housing market, particularly as defined by an expected deepening contraction in new home building. Observe the teetering price as relates to the underlying support offered by the most recent double low ($3.265-3.275) and the med-term 100-Day EXP-MA.
It was the following chart that really caught my attention.

Boom! 2 1/2 years of backwardation in copper is now officially over.
Greg Weldon went on to say:
"The chart above plots the 100-Day Exponential Moving Average of the Cash-to-Three Month Spread for Copper, traded on the London Metal Exchange. Copper’s spreads are in free fall, and this spread has completely wiped out all of its HUGE $200+ per tonne backwardation and has collapsed into contango, indicating an amply supplied market for the first time since the 4Q of 2003.
A breakdown in Copper would be a confirming signal, and ‘should’ provide the proverbial ‘next shoe to drop,’ in terms of a broadening disinflation becoming increasingly dominant in the entire commodities sector."
Flashback December 2005
Back in December of 2005 Sterling's World Report asked the question Will Dr. Bernanke Get Along with Dr. Copper?
Many traders have affectionately referred to copper as “Dr. Copper” because it is considered to be “the only metal with a PhD in economics.” That is, copper historically has been considered to be an excellent barometer of the overall state of global economic activity because of its widespread use in industrial applications.Although copper went on to soar way past $2.00 lb all the way to well over $4.00 lb in May of 2006, the message from Dr. Copper seems quite different today.
What Dr. Copper is saying right now is that the world economy is booming. As can be seen in Chart 1, the price of copper has nearly tripled since 2001 and is approaching $2.00 a pound. Much of that is attributable to the growth in China, which has created nearly insatiable demand for copper as it upgrades its electric power grid. But a booming housing market in the U.S. and strong growth throughout much of the developed and developing world are also part of the story.
A technical Break
We now officially have a break in that symmetrical triangle.
Let's take a look at a chart of copper as of September 22, 2006.

The interesting thing to me is that hardly anyone is taking these trendline breaks seriously even though there are breaks practically everywhere you look: oil, natural gas, sugar, the $CRB itself, and now a technical failure in copper. Yet posts of charts like these on Silicon Investor and other places just bring a big yawn. In fact, in a response to one of my blogs from just a day or so ago, someone used commodity charts to show "current inflation".
Has everyone really forgotten about the lagging effect of 17 consecutive rate hikes? No, not everyone. Brian and I at the Survival Report along with Greg Weldon and many of the professors on Minyanville are taking these breaks very seriously. Are the technical breaks in various commodities we see now akin to the technical breaks in JDSU, LU, CSCO, and INTC in 2000 that most disregarded? Right now it is hard to say, but the complacency and buy the dip mentality sure seems similar.
Perhaps this is nothing more than a head fake lower on gold, silver, natural gas, crude, gasoline, sugar, and copper. Then again perhaps the good doctor (along with confirming indicators such as M1 money supply, the inverted yield curve, and housing) is telling us that this patient (the US economy) is very ill. I think you know which way I am betting: The weakness in Housing is about ready to spill over into other areas. A consumer led recession is on its way.
Mike Shedlock / Mish
http://globaleconomicanalysis.blogspot.com/


No comments:
Post a Comment