The chart in that link shows it.
Could copper be next?
I think so, in spite of inventory concerns.
Let's look at a few charts.
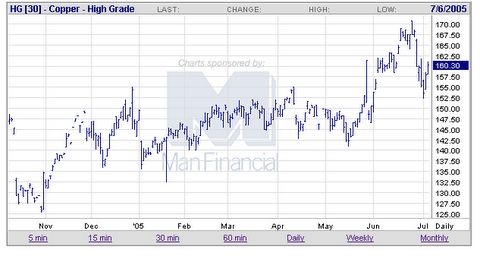
Here is a daily chart of copper:

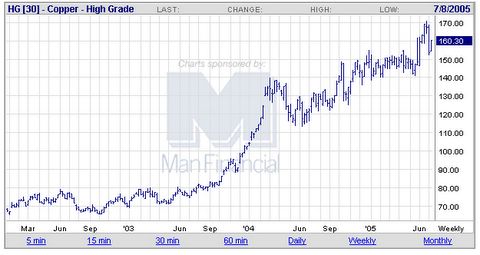
Here is a weekly chart of copper:

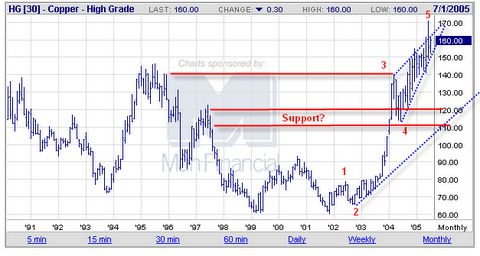
Those charts revealed little so let's take a look at the copper monthly chart.
Here goes:

That looks a lot more revealing.
Arguably we have traced out 5 waves up and are due for a correction.
I also do not like the look of that rising wedge and potential blow-off top.
But what about supplies Mish? Aren't CME inventories extremely low?
Yes they are. Some suspect we might run out. I suggest that supplies are almost always tight at the peak. My contact at Alaron thinks there are additional supplies available at non-CME approved inventories. There is also a reasonable chance of hoarding physical copper, hoping for higher prices. If higher prices do not appear, perhaps we see some big inventories becoming available.
It's tough to call tops but if the world economy is slowing and US housing stumbles (I think both are happening), barring one last blowoff I am inclined to think the highs are in or will soon be in. Those interested can watch day-to-day copper movements here.
The question is "how to play it".
Shorts would be fighting extreme backwardation.
This chart shows it:

Given the backwardation, option players would be fighting not only time but backwardation as well. At a minimum, taking profits off here, if one has been long for quite some time sure seems like the right move to me.
I believe that wedge breaks will break down hard with first support near 140. I do not think 140 will hold except for a short bounce. Ultimately I think copper corrects back to the 110-120 area that I highlighted on the chart. Perhaps the nature and length of the decline will indicate the next move.
Mike Shedlock / Mish
http://globaleconomicanalysis.blogspot.com/


No comments:
Post a Comment